Local Market Stats
July 8, 2020

June ended with lots of home sale activity around Greater Cincinnati. This week’s numbers: Search Numbers from last week: The local real estate market remains busy. Activity dropped a little over the holiday weekend. Still, buyers are competing and multiple […]
June 24, 2020

Real estate is local! The National Association of Realtors® and the Cincinnati Area Board of Realtors recently released home sales numbers for May 2020. As expected sales are down as the average sale prices rise. However real estate is local […]
June 19, 2020

May’s single-family home sales in Greater Cincinnati are chugging along. As predicted last month the impact of social distancing and jobs was not full-blown until mid-March. So the slow down in sales started to appear in April, May, and June […]
June 12, 2020

The Cincinnati housing market is off to a fast start. New listings are up! And an interesting part of greater Cincinnati real estate rests in new construction. Roughly 22% of the homes and condos on the market are “new construction.” […]
June 10, 2020

Banner week for real estate activity in Greater Cincinnati. The new numbers: Search Previous week: The local real estate market is very busy. Delayed spring buyers are competing with “gotta move now” buyers. Multiple offers on lots of the new […]
June 3, 2020

Weekly stats for real estate activity in Greater Cincinnati. The numbers for the past week: Previous week: New listings with multiple offers. The number of showings up. The largest problem facing the Cincinnati real estate market is the lack of […]
June 1, 2020
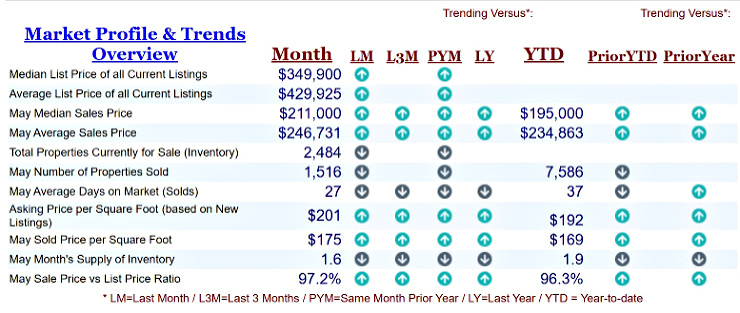
The first peek at Cincinnati single-family home sales during May. May single-family home sales were 1,516, down -30.0% from 2,368 in May of 2019 and – 10.2% lower than . Again, May 2020 sales were at their lowest level compared […]
May 27, 2020

Weekly stats for real estate activity in Greater Cincinnati. The numbers for the past week: Previous week: Seesaw numbers with fewer listings and more closings. Looking to move or questions about local market conditions-Contact