Snapshot of Greater Cincinnati Real Estate Market
Snapshot of Greater Cincinnati Real Estate Market
Look at a snapshot of the greater Cincinnati real estate market and buyers will see one picture while sellers see something slightly different.
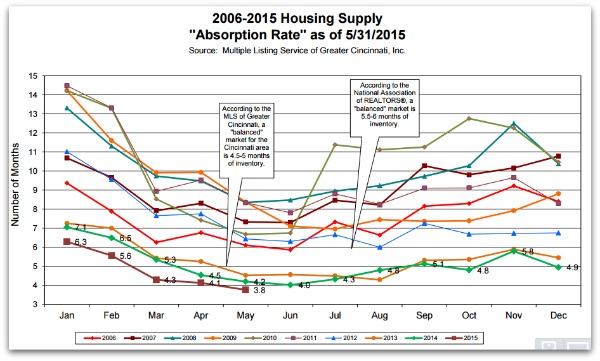
Coldwell Banker takes the data from the local multiple listings and shares graphs detailing our local market. The latest data available is for May, 2015. The first graph shows “absorption rate”. Think of it as supply/demand- given the number of properties for sale and how fast buyers are buying-how many months of worth of “inventory” is sitting on the market.

As of the end of May we only have a 3.8 month supply of homes/condos which should weight the local real estate market heavily toward sellers.

However the lack of proeprties for sale and somewhat unrealistic seller expectations keeps this market pretty balanced between buyers and sellers.
The number of closed deals in May of 2015 is higher than the number in May, 2014. However if you look at the numbers from 2006 – we’re not back to there -yet- but we’re moving in the right direction.

All-in-all the local real estate market is chugging along but not at full steam. More owners need to put their properties in order to entice buyers into actively looking and buying. It’s a crazy cycle and most of the public just doesn’t understand that fewer homes for sale doesn’t always translate into higher sale prices.


